Just as sustainability has multiple meanings, so too does being “green.” The natural world protected and untouched is one form of “green.” Our actions can be “green,” and society can be “green” when it exists in relative harmony and sustainability with the natural world around it.
At MPHOnline, we know that public health is a multivariate process. And that supporting sustainability and access to green spaces is part of supporting public health. To this end we’ve spent time researching the many ways in which states can be “green” (or not so green).
While America is often lauded for its natural beauty, there’s an astounding state-by-state range to how we interact with the natural world. In particular, this ranking looks at questions like:
- How much green space and protected green space does every state have?
- How quickly is this green space being protected or eroding even further?
- How easy to access is this green space for most people within a state?
- What infrastructure projects such as renewable energy and recycling programs are present in each state?
- How wasteful is each state?
- And a range of related questions.
You may be surprised by some of the entries in the following ranking, as close to 20 variables contributed to each state’s placement. While Alaska is undoubtedly “green” through some measures, it lags in fields like renewable energy, recycling, and access to much of its nature. While Rhode Island is small and highly populated, it excels at access to nature, renewable energy, and still has a sizable amount of protected green space.
How we ranked the 50 greenest states
We looked at a range of metrics all taken from authoritative subjects on the matter. The four categories of metrics utilized include:
Metric / Percentage of total score
- Green Energy Prevalence (25%)
- Open Spaces and Natural Beauty (25%)
- Waste Diversion and Recycling (25%)
- Social Justice and Access to Clean Outdoors (25%)

Green energy prevalence looked at the percentage of energy needs for the state that were provided by renewable energy sources in 2019. These numbers ranged from .77% to 100% of all energy needed (a huge spread!). This information was sourced from the US Department of Energy.

Open spaces and natural beauty looked at how many total acres of protected land were present in each state. This included major city, state, and national park systems. The total acreage of protected land was then divided by the total number of cubic acres in the state, giving a relative score of how much of the state is protected land. We also included public land not utilized for buildings. This was sourced from the Natural Resources Council of Maine and this study on national park land. Additionally, we looked at natural beauty rankings from a range of publications. While natural beauty is undoubtedly a subjective topic, many rankings tended to agree on the most and least naturally beautiful states to a large extent.

Waste diversion and recycling looked at a range of metrics including the total tonnage of landfill waste divided by the number of citizens of a state as well as the total tonnage of recycled batteries divided by the number of citizens in a state. National numbers for all types of recycling are unavailable. But as battery recycling is one of the oldest and most widely known-about forms of recycling we took this as representative of overall recycling programs within each state. These metrics were sourced from the U.S. Census, the Environmental Protection Agency , and Call2Recycle.

Social Justice and Access to Clean Outdoors is a category included based on the well established fact that the most disadvantaged demographics within the United States tend to have less access to open and natural space, and are disproportionately exposed to pollution and lack of clean natural elements. For this category we looked at well-established rankings on social justice rankings per state. This includes the number of programs and outcomes for special needs populations, diversity populations, and other special interest groups. We also looked at the range of days between air or water pollution warnings and violations per state, as well as the overall pollution levels of each state. Sources for these elements included the Environmental Protection Agency, and a social justice index by Loyola University New Orleans.
| State | Overall Rank | Green Energy Rank | Open Spaces and Beauty | Waste Diversion and Recycling | Racial Justice And Access to Clean Outdoors |
|---|---|---|---|---|---|
| Washington | 1 | 10 | 6 | 2 | 12 |
| Hawaii | 2 | 1 | 2 | 24 | 8 |
| California | 3 | 25 | 1 | 1 | 9 |
| Rhode Island | 4 | 1 | 29 | 16 | 3 |
| Maine | 5 | 1 | 25 | 4 | 28 |
| Florida | 6 | 18 | 6 | 5 | 14 |
| New Hampshire | 7 | 22 | 32 | 5 | 1 |
| Vermont | 8 | 21 | 40 | 2 | 2 |
| Delaware | 9 | 1 | 21 | 7 | 46 |
| Oregon | 10 | 7 | 39 | 15 | 9 |
| Minnesota | 11 | 12 | 45 | 17 | 3 |
| Michigan | 12 | 24 | 4 | 11 | 18 |
| Massachusetts | 13 | 16 | 5 | 18 | 25 |
| Maryland | 14 | 26 | 8 | 10 | 13 |
| New York | 15 | 15 | 8 | 30 | 16 |
| Nevada | 16 | 8 | 41 | 8 | 36 |
| Idaho | 17 | 1 | 46 | 25 | 30 |
| Wisconsin | 18 | 14 | 19 | 29 | 24 |
| Virginia | 19 | 37 | 13 | 12 | 7 |
| Tennessee | 20 | 20 | 21 | 27 | 21 |
| South Dakota | 21 | 9 | 38 | 35 | 20 |
| Connecticut | 22 | 31 | 16 | 19 | 21 |
| Missouri | 23 | 17 | 41 | 35 | 6 |
| Georgia | 24 | 19 | 37 | 40 | 16 |
| New Jersey | 25 | 40 | 10 | 22 | 14 |
| Pennsylvania | 26 | 41 | 18 | 9 | 31 |
| Iowa | 27 | 11 | 50 | 27 | 34 |
| Kentucky | 28 | 45 | 11 | 32 | 5 |
| North Carolina | 29 | 23 | 3 | 44 | 37 |
| Arkansas | 30 | 32 | 35 | 38 | 9 |
| Alabama | 31 | 27 | 29 | 32 | 39 |
| Nebraska | 32 | 13 | 48 | 37 | 40 |
| South Carolina | 33 | 28 | 29 | 34 | 38 |
| West Virginia | 34 | 49 | 17 | 25 | 23 |
| Colorado | 35 | 42 | 15 | 19 | 43 |
| Texas | 36 | 44 | 21 | 13 | 44 |
| Ohio | 36 | 38 | 26 | 30 | 35 |
| Arizona | 38 | 30 | 13 | 41 | 42 |
| New Mexico | 39 | 48 | 32 | 21 | 27 |
| Montana | 40 | 36 | 26 | 38 | 32 |
| Wyoming | 41 | 51 | 24 | 22 | 28 |
| Mississippi | 42 | 33 | 43 | 48 | 18 |
| Utah | 43 | 46 | 12 | 13 | 50 |
| Kansas | 44 | 35 | 49 | 41 | 25 |
| Illinois | 45 | 34 | 28 | 43 | 45 |
| Indiana | 46 | 29 | 34 | 45 | 48 |
| North Dakota | 47 | 39 | 47 | 46 | 32 |
| Oklahoma | 48 | 43 | 43 | 47 | 40 |
| Alaska | 49 | 50 | 19 | 50 | 46 |
| Louisiana | 50 | 47 | 36 | 49 | 49 |
America’s Greenest States
A look at the “greenest” states in America has many long-time champions of sustainability. While all states can undoubtedly improve some aspects of their sustainability plans, many of the most “green” states in America are leaders worldwide among sustainability.
How Green in Washington State?

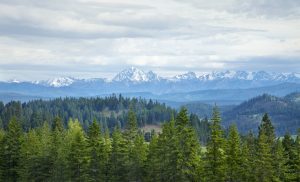
Washington state comes in first in our ranking but was not in the very top rank for any metric considered. Rather, Washington State was among the top 10 states in the nation for nearly every metric. Roughly 36% of Washington is owned by the Federal Government as protected land (no buildings or industrial use). Roughly 12% of this land is designated park land, meaning roughly 4% of the state as a whole is park land. In effect, much more of the state is explorable via large swaths of public land throughout both the eastern plains of the state, and 64 named mountain ranges within the state.
Other “green” factors worth noting about Washington include it’s close to top-ranked scores for landfill size, and recycling rates. Additionally, access to nature, social justice scores, and pollution all ranked towards the top.
How green is Rhode Island?
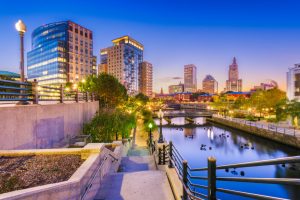
 Potentially a surprise to many not from Rhode Island (which is most people), Rhode Island scored particularly well across the range of metrics we considered. Rhode Island is one of only a handful of states to aim for 100% renewable energy in the near future. Currently Rhode Island is on track to be one of the first states to reach this target with an estimated date of 2030. This is largely due to the presence of the nation’s first offshore wind turbine farm located in Rhode Island.
Additional categories in which Rhode Island scored very well include the amount of green space per capita. While Rhode Island doesn’t have a huge number of parks per se (it is the smallest state), for every three citizens of the state, 1 square acre is designated as park land. State parks dot the landscape of the state as a whole, ranging from forests upstate to oceanfront land along the coast. Impressive public transit provides access to many parks and upper quadrant social justice scores bode well for citizen exposure to pollutants as well as access to parks.
How green is Hawaii?

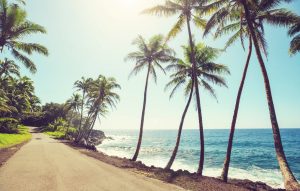
One of a handful of states that likely conjures up natural beauty before any man made institutions, Hawaii should come as no surprise as one of the “greenest” states in the Union. Our 50th state is also our most isolated and surrounded by the ocean. In-depth tracking of the health of sea environments up to three miles out from every island adds to the “green” footprint.
Like Rhode Island, Hawaii is one of a handful of states aiming for 100% renewable energy in the near future. Presently close to 40% of the state’s energy comes from solar panels. Wind turbines and geothermal energy drawn from volcanic heat also play an important role in the state’s sustainability.
Additional metrics that mattered in Hawaii’s ranking as a green state include a high percentage of protected and park land, a very low landfill footprint, and quality access to nature score (walk to the beach anyone?).
America’s Least Green States
America’s least green states tended to encounter low scores in a range of related indicators. Many of these states have some of the worst social justice scores as well as highest pollution levels. This trend has been documented numerous times with the latest statistics noting that minorities are likely to encounter 60% more air pollution than they cause. Additionally, even if many of these states have large Federal holdings of land, some of the smallest percentages are set aside as protected or park land (Alaska is an outlier in this regard). The three worst ranked states also had among the ten worst scores in renewable energy production, landfill use, and recycling.
How “Un-Green” is Louisiana?
Where Louisiana excels at culture, it certainly lacks in preservation or sustainable engagement with the environment. This should come as no surprise to individuals who followed the BP oil spill or the state’s continued record-setting pace of losing important environments (on average, the state loses around a football field of land an hour to rising sea levels and erosion).
There are undoubtedly still beautiful habitats and green spaces to be found in Louisiana. But for the purposes of our ranking they tend to be some of the least accessible or protected in the nation. Additionally, renewable energy use in the state is exceedingly low despite readily available solar and hydroelectric capabilities. While most states have a shocking tonnage of landfill waste per person, Louisiana is close to the bottom with almost 38 tons of waste in landfills per resident.
We hate to harp on the land of jazz, gumbo, and zydeco, but the proof is in the pudding that for Louisiana to gain any semblance of being “green” or sustainable, rapid and comprehensive change is needed now.
How “Un-Green” is Alaska?
Alaska, UN-GREEN? This was a shocker to us as well. And we grant that by some metrics Alaska is indeed among the greenest of states. Home to the largest collections of Federal, park and protected lands in the nation, Alaska has every right to be called “green” (in a sense).
The issues we found with Alaska may in part be due to its uniqueness. Home to potentially the harshest winters of anywhere in the United States, Alaska is prone to high energy usage. With a relatively low population and many isolated communities, infrastructure around recycling is low. Landfill use per capita is high. And surprisingly (due to the abundance of natural resources) renewable energy use is among the worst in the nation.
While the actual human footprint on Alaska is quite small compared to other locations, efforts to minimize this human footprint are also quite low. New developments including the opening up the Arctic National Wildlife Refuge for oil drilling also don’t bode well. The range of untouched land may hold steady for now. But per our reading of sustainability centered around both human actions and the state of the environment, the state has a ways to go.
How “Un-Green” is Oklahoma?
The third oil-drilling-heavy state in our bottom three “green” states is Oklahoma. Home to regular earthquakes caused by fracking, its easy to see that natural or human well-being may not be at the top of the list of priorities for the Sooner State. Factors that played into our ranking of Oklahoma included the lowest rate of recycling in the nation, the highest landfill footprint per capita in the nation, and the 7th lowest volume of parkland per resident.
With all of this said, there is definite natural beauty among the rolling hills and desert landscape of the state. The southern United States largest and oldest national forest can be found at the Ouachita National Forest. The Little Sahara State Park provides around 1,600 acres of large sand dunes to explore. And the Tallgrass Prairie Preserve is the largest protected tallgrass prairie ecosystem in the world.
Source: https://www.mphonline.org/


