


1. Introduction
Through ecological problems, we need to recognize the critical issues of the institutions and standards of contemporary society—and find more fundamental and active implementation efforts in order to call actions ‘green’. In ‘democracy’, green refers to consideration of the politically disadvantaged [1,2]; in ‘welfarism’ it refers to the socially and economically disadvantaged [3,4,5,6]; and in ‘ecology’, green includes all issues regarding the ecologically disadvantaged and aims to completely restructure political, social and economic institutions [7,8,9,10]. Concentrating on ecological problems, green strongly incorporates awareness of political issues, and by examining the existing developmental framework and the values and institutions that have supported it so far, it seeks to find alternatives [11,12,13]. Therefore, from the viewpoint of green politics, the re-evaluation of the current stance of the ‘state’ as the impartial enforcer of governmental authority is a key factor [14,15].
Globalization has weakened the power of the state; however, in order to fundamentally prevent damage to the ecological environment, an alternative society that is eco-friendly should be sought out, and for this reason, the role of the state as the authoritative body nevertheless is needed. A state that fulfils these terms is called an ‘ecological state’ [16], or ‘eco-state’ [17,18], or an ‘environmental state’ [1], but for the purpose of this research, we shall call it ‘Green State’ [5,19,20]. According to the works of Dryzek, et al. [20], a green state strives to achieve an ecologically sustainable society by aiming for political, economic, and institutional change as a whole, based on ecological rationality. Another scholar who has produced comprehensive research on the green state, Eckersley [5] explains that the green state is defined as “a democracy where the ideology of regulation and the democratic procedure is led by ecological democracy, rather than liberal democracy”, and emphasizes the ecologically responsible statehood. Also, the green state differentiates itself in the core logic and role of the state’s main responsibilities with previous theories such as the industrial state, developmental state, welfare state, even the competition state or entrepreneurial state, both which are valued in the era of economic globalization [21,22].
However, this study highlights that, even though the conceptions of green states have been proposed in different forms in various research, there are very few empirical works [23]. In fact, although the studies on the background and significance of green state theory [5,24,25,26], the argument about the theoretical type of green state and its development process [19,20], and the discussions of various tasks and development direction of green government [27,28] have been underway, these studies have also shown limitations in analyzing empirical factors of a green state, analyzing causal contexts, and failing to draw conclusions based on empirical data.
In this regard, this study aims to develop empirical variables for each of the four green state categories (‘ecological authoritarian state’, ‘ecological modern state’, ‘ecological democracy state’, and ‘ecological welfare state’) that can be aggregated based on various studies of theoretical categorization on the green state, including [1,14,29]. Particularly, by employing the fuzzy-set analysis, a qualitative comparative research methodology to deal with middle-N cases that comparative case analysis and regression analysis could not address, this study attempts to reveal the features of joint causal structure and interaction between the four green state categories. Then it draws on the findings of the causal sets of green state through the fuzzy-set multiple conjunctural analysis and also the findings of the ideal types of green state through the fuzzy-set ideal type analysis (STATA 12.0 used).
In this study, twenty-four OECD (Organization for Economic Cooperation and Development) countries were selected that could collect relevant data (the most recent all seven variables—‘environmental tax’, ‘environmental innovation’, ‘GDP per capita’, ‘Democracy Index’, ‘environmental governance’, ‘social expenditure’, and ‘environmental health’—required by the measurement framework) on the four theoretical categories of green state from all thirty-five OECD countries. In short, this paper explores the following research questions: how do the conjunctural causal relationships of the causal set (the four green state categories) and the outcome set (symbolized by Sustainable Development Goal Index (SDGI)) appear in OECD cases?; and how do the green state ideal types of the OECD countries form and what implications do they have?
This paper is structured as follows: in Section 2, it discusses the four theoretical categories of green state. In Section 3, it explains the rationale of the fuzzy-set analysis methodology and set up the measurement frame works including the variable composition of outcome and causal sets, and the variable composition of the ideal type analysis. In Section 4, this paper presents the findings of fuzzy-set multiple conjunctural analysis and of fuzzy-set ideal type analysis, and also the implications of the levels of green states.
2. Theoretical Background: Categories of Green State
The theoretical categories and conceptions of green states are various. In general, from the authoritarian ecological state and ecological anarchy society discussions in the 1970s, discussions have moved on to eco-socialism in the 1980s, and since the 1990s, studies can be largely divided into the following four discourses.
2.1. Ecological Authoritarian State
As the first argument in the course of the green state, it focuses on the ‘ecological authoritarian state’. This discussion emphasizes the role of the state as an efficient authority to enforce strict environmental restrictions for the sake of environmental policy [29,30,31,32]. By recognizing the authoritarian intervention of the state for issues concerning environmental problems and resource depletion, it can be understood in the context of administrative rationalism [30,33,34].
The reasons for requiring an ecological authoritarian state is, first, that amidst the problems of the depletion of national resources and worsening environmental problems, the role of the state is demanded to solve the contradictive society that aspires to protect the environment and at the same time, free ride on what it can. Second, individuals try to profit from the environment, but are not willing to contribute to solving the environmental problems caused by their initial actions. Third, the characteristic of industrial capitalism, which lies at the heart of modern liberal democracy, is unlikely to voluntarily reduce environmental pollution. Fourth, the state functions as an unbiased and impartial organization and is capable of constructing cautionary conditions for sustainable development [30,33].
2.2. Ecological Modern State
The second green state discussion proposes the ecological modern state. It first appeared in the 1992 Rio Earth Summit (UN Conference on Environment and Development) where Sustainable Development (SD) started to become a global paradigm. Sustainable Development has since been understood as being comprised of three pillars: social development and inclusion; environmental conservation; and economic growth [35,36]. The modern ecological state strives to combine economic growth and environmental protection and aims to decouple the process of consumption and waste discharge with economic prosperity [32,37], which can be symbolized by the concept of the environmental Kuznets curve (EKC) [38]. Also, under the value of cooperation between the three parties, market, state, and the civil society, the modern ecological state views the self-learning process of institutions as a state reform program [24]. Rooted in modern ecological theory, the argument acknowledges the structural elements of environmental problems and these issues are brought within the current political, economic and social framework to harmoniously achieve economic growth and environmental preservation, and have started to appear in countries such as Germany and Norway among others [39,40,41].
The ecological modern state theory is understood to overcome environmental problems policy-wise and maintain economic growth and puts emphasis on the coexistence of environmental protection and economic development [15,32,42]. The theory can be defined as the discussion that believes it can solve environmental problems and achieve economic growth simultaneously through reconstructing the capitalist political economy for modernization by concentrating on the environment [15,41]. This theory can be partially understood by economic rationalism. Therefore, the ecological modern state does not interpret environmental destruction as a structural consequence that cannot be avoided; rather it accepts it as an element of challenge in social-technical and economic reform, and emphasizes change in the current systems of science, technology, politics and the market for the purpose of environmental improvement [26,40].
2.3. Ecological Democracy State
The third argument focuses on the ecological democracy state. Based on the ecological value and principle, ecological democracy revolves around the democracy that comes from the reciprocal relationship between human and human, human and nature, and human and non-human [2,43]. The ecological democracy state has discussed alternative democracy that features the characteristics of deliberative and radical democracy and of the combination of ecological theory—and was the reasoning behind the green discourse of the West in the 1990s [14,44,45].
A green democracy is the potential element embedded within the discussions of the ecological democracy state and believes that only a democratic state possesses the openness, flexibility, coherence, and legitimacy to manage the complicity and uncertainty in environmental problems [4,14,43]. Additionally, in research discussing the ecological democracy state, Habermas’s communicative rationality and deliberative democracy are emphasized, and in this context, ecological democracy can be categorized as democratic pragmatism [2,45].
2.4. Ecological Welfare State
The fourth discourse is the ‘ecological welfare state’; the collaboration of environmental and welfare issues. It has its roots in the traditional state (republican tradition), which is believed to realize common good—and deliver a rational and sovereign state. Here, the state is the medium that constructs citizens with responsibility [17,46]. There are two branches in the discussion of the ecological welfare state. The first combines the previous Keynesian welfare state and environmental issues [47,48], emphasizing the state that claims serious responsibility for managing the environment, and also a state that establishes structure and program so that man-made environmental activity cannot erode the social and economic foundation [49].
The second branch is the third-party position of the collaboration of the welfare state and green democracy, where the research of Eckersly [11]’s ‘Formation of the natural state (incorporating the value order of general ethics into the constitution, and a state that is at peace with nature) is the most well-known [41]. On the other hand, research on the ecological welfare state is actively pursued in terms of environmental justice, since the damages of environmental pollution can vary according to different social classes, and while efforts are being made to resolve this phenomenon, the emphasis is put on both environmental protection and the inequality, which can be caused by environmental dangers [50]. The comparison of the four theoretical categories of green state is explained in Table 1.
Table 1. The Comparison of the Theoretical Categories of Green State.

3. Methodology and Measurement Framework
3.1. The Rationale of Fuzzy-Set Analysis
The Fuzzy-Set Analysis (methodology) is a special form of case study method known as Qualitative Comparative Analysis (QCA), suggested by Zadeh from the University of Berkeley in 1965, and it has been used in diverse ways by scholars, such as Ragin and Kvist, in application to Social Sciences [51,52]. The fuzzy-set analysis is an improved version of the method from Qualitative Comparative Analysis [53,54] previously used in Social Sciences. Going beyond the permission of the existing traditional two membership scores, 1 or 0, by using crisp set/set theory, utilization of fuzzy set with various membership scores between 0 and 1 can present not only the partial memberships but also the difference of the degree.
Specifically, the fuzzy-set analysis has some major advantages. First, through exercising the fuzzy-set methodology, disadvantages of case-oriented study and variable-oriented study can be overcome. The fuzzy-set analysis categorizes cases by a combined method of two strategies that variable-oriented quantitative methodology and qualitative case study take, and it distinguishes itself from the existing analysis/methodology by examining social diversity through comparative study [51,53]. Second, due to this property, the fuzzy-set analysis enables dealing of the middle-case studies (15-25cases) that comparative case analysis and regression analysis could not address despite being substantial subjects to analysis and makes middle-class comparative analysis possible [51,53]. Moreover, it is also used in analyzing joint causal relations by paying due consideration to interactive effects between each quality in a given case [51,52].
Third, it can explain diverse social phenomenon. The fuzzy-set analysis overcomes this dichotomy method of 0 and 1 that have been used in many previous studies by enabling representation of various degrees between the 0 and 1, which minimizes the loss of information in the analysis [51,55]. Fourth, it enables a more theoretical approach to the categorization of types. Many researchers have been using quantitative statistic methods such as cluster analysis to categorize types [56,57]. While these types are confronted by criticism to be categorized by arbitrary interpretation of the researchers, however, the fuzzy-set analysis determines the number of memberships by categorization standards that consist the ideal type extracted under theoretical background [51,58]. Accordingly, many recent studies are applying fuzzy-set analysis to categorizing types [59,60].
3.2. Fuzzy-Set Multiple Conjunctural Analysis and Ideal Type Analysis
In the causal relationship between cause and effect (outcome) conducted in the existing quantitative analysis, the results did not perfectly correspond according to whether there was a cause or not. That is, there was the point during which it was difficult to distinguish correlation and cause and effect (outcome). However, the Fuzzy-Set Multiple Conjunctural Analysis, which defines the relationship between cause and effect as a necessary condition or a sufficient condition, has the advantage of overcoming such a problem. Other than that, as mentioned previously, it can be a powerful tool when it comes to analyzing the causal complexities in intermediate level case studies.
Contrary to the existing multiple regressions, the methodologies by the Fuzzy-Set Multiple Conjunctural Analysis are mainly divided into the following three. First, the problems of a degree of freedom and multi-collinearity that may occur due to a small number of cases in the existing regression analyses can be overcome. In order to secure the necessary statistical significance for researching the causality of dependent variables and independent variables in regression analysis, there has to be a sample of thirty or more. In addition, the statistical degree of freedom problem and the multi-collinearity problem due to the correlation between independent variables and the linear model assumption may occur. However, the Fuzzy-Set Multiple Analysis is able to analyze the combination of the reason variable conditions by targeting small number of cases. In other words, it has the advantage of being able to analyze the combination of causal conditions without having to use the assumption of the independence between variables and the linear relationship.
Second, Fuzzy-Set/QCA is the analysis, which combined quantitative analysis and qualitative analysis. It sets causal conditions and outcome conditions by qualitatively considering cases and variables and derives logical effects (outcomes) by going through the process of conversion into quantitative data. Third, it has the strength of identifying causal relationship by variously integrating not only the unilineal effects by certain variables but also multiple causal conditions [54,61].
On the other hand, this research also categorizes twenty-four OECD countries through comparative analysis by utilizing Fuzzy-Set Ideal Type Analysis. Fuzzy-Set Ideal Type Analysis represented by fuzzy membership scores demonstrates by applying Fuzzy-Set Theory how close the subject of analysis is that is converted into fuzzy sets [62,63]. Through this process it analyzes the degree of memberships of each category, translating the existing original data results into fuzzy-set membership scores. As the number of the sets is decided by the ideal type, different from the existing cluster analysis, through Fuzzy-Set Ideal Type Analysis that this research conveys, more systematic categorization and interpretation become available [59,60,64].
The criteria for interpretation of membership scores of Fuzzy-Set Ideal Type Analysis drawn from this research is based on the one suggested by Ragin [54]. In particular, after this study converted the scores into the fuzzy-set score system through the calibrate function of STATA 12.0, it measured them according to 3 qualitative anchors: ‘fully in’, ‘fully out’, and ‘crossover point’ as in the degree of the two. In other words, any score that is higher than the crossover point (0.5) is given strong membership (in the case the degree of full membership the given value possesses (FI: fully in or full membership) is higher than 95% (0.95)), and any score below is given low membership score (in the case the degree of full membership is not present (FO: fully out or full non membership) is lower than 5% (0.05)). The formula for calculating Degree of Membership Score in Fuzzy-Set Idea Type Analysis is as follows:
Degree of Membership = exp(log odds)/(1 + exp(log odds))
3.3. Measurement Frameworks
As described in Table 2 below, this study presumes that the UN Global Goals for Sustainable Development (SDGs) with seventeen agendas are the universal framework for which all 193 UN member states have signed and can be symbolized as the goals of the green state. Therefore, it regards the Sustainable Development Goal (SDG) Index [65] as the outcome set of the fuzzy-set multiple conjunctural analysis. SDG Index—produced by the Sustainable Development Solutions Network (SDSN—a global initiative for the UN) and the Bertelsmann Stiftung—shows how 193 UN member states are performing the UN Global Goals for Sustainable Development (SDGs) and how the Agenda 2030 can be implemented. SDG Index was built on a set of 232 indicators for each of the 17 SDGs using the most recently published data.
Table 2. The Variable Framework of Outcome and Causal Sets.
For the causal sets, as described in Table 1, the seven detailed variables of four variable categories (‘Ecological Authoritarianism’ (A), ‘Ecological Modernization’ (M), ‘Ecological Democracy’ (D), ‘Ecological Welfare’ (W)) were selected respectively. In the first A category, the detailed variable of ‘Environment-related Taxation’ refers to environmentally related taxes, proportion (%) of total government tax revenue. It can be regarded as a key element in relation to enforcing strict environmental restrictions for the sake of environmental policy in ‘Ecological Authoritarianism’. The second M category consists of the both detailed variables. ‘Environment-related Innovation’ is characterized by the patents (counts) in environment-related technologies and innovation, and ‘GDP per capita’—GDP per head of population, USD, constant prices. Both of the detailed variables are in line with the context of combining economic growth and environmental protection, particularly emphasizing a socio-technical and economic reform in ‘Ecological Modernization’.
In the third D category, the detailed variable of ‘Democracy Index’ produced by the Economist, based on five categories: electoral process and pluralism, civil liberties, the functioning of government, political participation; and political culture, was included. Also ‘Environmental Governance’ of ESI (Environment Sustainability Index), focusing on including environmental policy and regulations, civil and political liberties, and government effectiveness, was selected. Both of the detailed variables are included in light of democracy focusing on the reciprocal relationship among human, nature, and non-human, and of alternative democracy. The fourth W category consists of ‘Social Expenditure’, social welfare expenditure of public and mandatory private (% of GDP), and ‘Environmental Health’ of EPI (Environment Performance Index), integrating six indicators in the areas of air quality, water and sanitation, and heavy metals. Two of the detailed variables are in line with the context of collaboration of environmental and welfare issues in order to realize common good in ‘Ecological Welfare’.
This study takes the cases of twenty-four OECD countries out of all thirty-five member countries, in which the data of each variable in the four categories above are available. It attempted to collect the most recent data that may best show the characteristics of the seven detailed variables (from Y2005 to Y2018).
In addition, regarding conducting the fuzzy-set ideal type analysis, we first weighted and standardized the seven detailed variables and placed them in each of the four type variables (see Table 3). Second, we converted (calibrated) the four type variables into fuzzy scores by utilizing the three anchors (minimum, median (p50), and maximum) respectively, to identify the types of green state in OECD countries.
Table 3. The Variable Framework of the Ideal Type Analysis.
The degree of membership in this research is calculated and interpreted by the ‘principle of negation’, the ‘minimum principle’, and the ‘maximum principle’. This research sets the four category variables ‘Ecological Authoritarianism’ (A), ‘Ecological Modernization’ (M), ‘Ecological Democracy’ (D), ‘Ecological Welfare’ (W) that has been reviewed previously. In this case, the principle of negation enables setting up negative categories of ‘a’, ‘m’, ‘d’, and ‘w’ through ‘1-fuzzy-set membership score of the applicable category’. Accordingly, the ideal type is determined by applying a number of cases that each category variable can take, and this research postulates sixteen ideal type sets (high or low) based on the four category variables (see Table 4).
Table 4. The 16 Ideal Type Sets.
In addition, these sixteen ideal type sets are yielded and interpreted by the ‘Minimum Principle’ and the ‘Maximum Principle’ [55,63]. The ‘Minimum Principle’ states that it is the minimum value among the fuzzy-set scores drawn from the principle of the sixteen types of ideal type categorization that will be the fuzzy-set membership score of the respective categories; in other words, among the fuzzy scores of the four variables (A, M, D, W) that consist of the corresponding category sets, the minimum value will be selected. For example, if the fuzzy score of A in Category ‘A*M*D*W’ appears to be the minimum value, the fuzzy-set membership score of Category ‘A*M*D*W’ will be denoted as the fuzzy score of ‘A’ itself. Moreover, the ‘Maximum Principle’ postulates that while the fuzzy-set membership score of twenty-four OECD countries can conclusively be presented by sixteen types of categories, one with the maximum value of the membership score will be the category for the corresponding area.
4. Analysis Results and Implications
4.1. Findings of Fuzzy-Set Multiple Conjunctural Analysis
The analysis model of this study consists of the outcome set of the SDG Index (SDGI) of twenty-four OECD countries, and of the causal set of the seven variables in the four categories, all of which are expressed in uppercase as shown below. Lowercase indicates the complement of the set
Model: SDGI = T (Env.-related Taxation) + I (Env.-related Innovation) + G (GDP per capita) + D (Democracy Index) + V(Env. Governance) + O(Social Expenditure) + H (Env. Health)
For the necessary conditions (if the outcome set is a subset of the causal set, the score of the outcome set belongs to the cause set), the Y-consistency test was conducted in this study. The four detailed variables (G (0.833), D (0.886), V (0.894), H (0.820)) were verified to be above ‘Y-cons > 0.80’ (benchmark proportion, ‘almost always’), and the three detailed variables (T (0.668), I (0.659), O (0.794)) were found to agree with ‘Y-cons > 0.65’ (benchmark, ‘usually’). The concept of consistency means that the relationship between causal conditions and outcome conditions is significant and influential. In case of the sufficient condition, 0.65~0.8 is generally used.
As shown in Table 5, there are fourteen sets (of the total 128) in the truth table of the causal set for the outcome set, satisfying the condition of the existence of cases and the significance level, p < 0.5. Also, the seven sets of the fourteen are above Y-consistency 0.80 (benchmark proportion, ‘almost always’). In other words, according to this criterion, a total of seven sets describing a high outcome (SDGI, upper case) set are found.
Table 5. Truth table of the causal set for the outcome set.
Among the seven sets (above Y-consistency 0.80), there are both sets with more than two case countries (best fit) respectively. The first arrangement is ‘TiGDVOHS’ (high environmental taxes (T), low environmental innovation (i), high GDP (G), high democracy (D), high environmental governance (V), high social expenditure (O), high environmental health (H), and high outcome (S)), the best fits of which (cases) are Denmark and Finland (Y-cons. 0.986). The second is ‘tIGDVOHS’ (low environmental tax (t), high environmental innovation (I), high GDP (G), high democracy (D), high environmental governance (V), high social expenditure (O), high environmental health (H), and high outcome (S)), the best fits (cases) of which are Sweden and Switzerland (Y-cons. 0.974).
This study, in order to verify the sufficient condition (if the causal set becomes a subset of the outcome set, the score of the outcome set is higher than the score of the causal set), conducted the verification of both Y-consistency and N-consistency (See Table 6). It sets the benchmark as .80 and the significance level of 0.5 (p < 0.05). As described in Table 6, there are five sets that were found, which satisfy the Y-consistency and N-consistency validation of the ‘sufficient condition’ for the outcome set (SDGI), and also include the best fits (a total of nine sets without best fits (country cases)).
Table 6. Y and N Consistency of the Sufficient Condition for Sustainable Development Goal (SDG) Index (Outcome).
As a result, the possible arrangements of the five causal sets are tiGDVoH, tIGDVoH, tIGDVOH, TiGDVOH, and TIGDVoH. Through the ‘reduction process’, the arrangements are reduced as the two causal sets: T*I*G*D*V*O + G*D*V*H. The solution consistency of the causal set of the sufficient condition is 0.980 and the total coverage (explanatory range) is 0.675. Both the consistency and the coverage are significantly high (See Table 7 below).
SDGI = TIGDVO + GDVH = (Env.-related Taxation * Env.-related Innovation * GDP per capita * Democracy Index * Env. Governance * Social Expenditure) + (GDP per capita * Democracy Index * Env. Governance* Env. Health)
Table 7. The Causal Set of the Sufficient Condition for SDG Index (Outcome).
To summarize, the causal set of the sufficient condition explains as follows. Among OECD member countries, if ones have high environmental tax, high environmental innovation (patent), high economic development and democracy, high levels of environmental governance and social expenditure, or have high economic development and democracy, and high levels of environmental governance and environmental health, they highly achieve the Sustainable Development Goals. Namely, they can be seen to have reached a high level of a green state.
4.2. Findings of Fuzzy-Set Ideal Type Analysis
Through the fuzzy-set ideal type analysis, thirteen ideal types of green state (among sixteen ideal types) of twenty-four OECD countries were derived (except ‘TMdW’, ‘tmDW’, and ‘tmDw’). As shown in Table 8 below, the fuzzy scores for each of the types are shown in bold and shaded. In particular, Type 1 (in blue color) has a high degree of ‘A*M*D*W’, that is, the four features of green state (Ecological Authoritarianism, Modernization, Democracy, and Welfare) are respectively high. Norway (fuzzy-set membership score of 0.515) is a country of ‘A*M*D*W’, which seems to have a characteristic of ‘strong green state’. On the other hand, Type 13 (‘a*m*d*w, in red color) shows all of the four low features (ecological authoritarianism, modernization, democracy, and welfare), and Greece (membership score, 0.692) and Ireland (0.577) are included. They appear to be characterized by ‘weak green state’.
Table 8. Results of Fuzzy-Set Ideal Type Analysis by OECD Countries.
Type 2 (A*M*D*w: high Ecological Authoritarianism, Modernization, Democracy, and only low ecological welfare) includes the UK (membership score 0.525) and Sweden (0.508). Type 3 (A*M*d*w: high Ecological Authoritarianism, Modernization, and low ecological democracy, welfare) belongs to the United States (membership score, 578). Type 4 (A*m*D*W: high Ecological Authoritarianism, Democracy, Welfare and only low ecological modernization) includes Poland (membership score, 0.594), Switzerland (0.555) and Netherlands (0.525). Type 5 (A*m*D*w: high Ecological Authoritarianism, Democracy, and low ecological modernization, welfare) belongs to Japan (membership score, 0.503). Type 6 (A*m*d*W: high Ecological Authoritarianism, Welfare, and low ecological modernization, democracy) includes the Slovak Republic (membership score, 0.572) and Spain (0.532).
Type 7 (A*m*d*w: only high Ecological Authoritarianism, and low ecological modernization, democracy, welfare) belongs to Portugal (membership score, 0.599) and Korea (0.519). They can be called ‘green authoritarian state’. Type 8 (a*M*D*W: only low ecological authoritarianism, high Ecological Modernization, Democracy, and Welfare) includes Finland (membership score, 0.582), Germany (0.506) and Italy (0.503). Type 9 (a*M*D*w: low ecological authoritarianism, welfare, and high Ecological Modernization, Democracy) belongs to Hungary (membership score, 0.510) and Austria (0.502). Type 10 (a*M*d*W: low ecological authoritarianism, democracy, and high Ecological Modernization, Welfare) includes Belgium (membership score, 0.532). Type 11 (a*M*d*w: low ecological authoritarianism, democracy, welfare, and only high Ecological Modernization) belongs to Australia (membership score, 0.623) and France (0.507). Both countries can be called ‘green modernization state’. Type 12 (a*m*d*W: low ecological authoritarianism, modernization, democracy, and only high Ecological Welfare) includes Denmark (membership score, 0.657) and Canada (0.611). Both countries may be symbolized by ‘green welfare state’.
5. Conclusions: The Levels of Green State
This study has attempted to set up an empirical measurement framework of green state and compare twenty-four OECD countries’ cases through the fuzzy-set multiple conjunctural analysis and the ideal type analysis. It has looked at both research questions: how the conjunctural causal relationships of the causal set (the four green state categories) and the outcome set (Sustainable Development Goal Index) appear in OECD cases, and how the green state ideal types of the OECD countries form and what implications they have. In short, this paper reveals the arrangements of two causal sets: T (env.-related taxation) * I (env.-related innovation) * G (GDP per capita) * D (democracy index) * V (env. governance) * O (social expenditure) + G (GDP per capita) * D (democracy index) * V (env. governance) * H (env. health). The consistency, sufficient condition, is 0.980 (according to the benchmark proportion, ‘almost always’) and the total coverage, explanatory range, is 0.675 (significantly high). In addition, the 13 ideal types of green state of 24 OECD countries were derived. Norway (fuzzy-set membership score of 0.515) belongs to Type 1, ‘strong green state’ with the all four high features of green state categories. Greece (membership score, 0.692) and Ireland (0.577) are countries of Type 13, characterized by ‘weak green state’ with the all four low features.
Meanwhile, the fuzzy-set ideal types of each of these OECD countries can be regarded as types of green state that carries the degree of ‘green’. Because the fuzzy-set multiple conjunctural analysis of this study confirmed that seven green state-related variables satisfied the necessary condition and consequently showed the causal complexities into the outcome set (SDG Index) through the verification of sufficient condition: SDGI = (Env.-related Taxation * Env.-related Innovation * GDP per capita * Democracy Index * Env. Governance * Social Expenditure) + (GDP per capita * Democracy Index * Env. Governance * Env. Health). The causal complexities were revealed in all upper cases, referring to all high degrees of seven variables that consist of the four theoretical types (features) of green states: ‘Ecological Authoritarianism’, ‘Ecological Modernization’, ‘Ecological Democracy’, ‘Ecological Welfare’, as explained previously in Table 2. In other words, the all four categories of green state emphasized by this study are very eligible for the key components of green state
As a result, through the results of this fuzzy-set multiple conjunctural analysis and ideal type analysis, this study indicates that the green state types of twenty-four OECD countries can be divided into the five levels: ‘Strong Green State’, ‘Quasi-Strong Green State’, ‘Quasi-Green State’, ‘Quasi-Weak Green State’, and ‘Weak Green State’ (see Figure 1 below; different shades of color depending on the result levels).
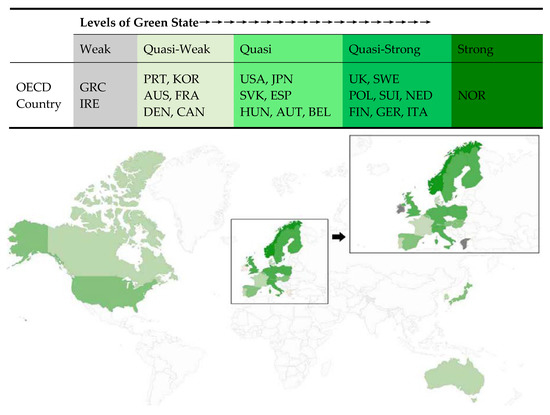
Figure 1. Implications of the five levels of OECD green states.
The ‘Strong Green State’ in which all four characteristics (types) of the green state are prominent is Norway. The ‘Quasi-Strong Green State’, in which three characteristics (types) of four are clearly visible, includes a total of eight countries: the United Kingdom, Sweden, Poland, Switzerland, the Netherlands, Finland, Germany, and Italy. In the ‘Quasi-Green State’, two of the four characteristics of the green state, the seven countries are included: the USA, Japan, Slovakia, Spain, Hungary, Austria, and Belgium. The ‘Quasi-Weak Green State’, which has only one characteristic includes six countries: Portugal, Korea, Australia, France, Denmark, and Canada. Finally, the ‘Weak Green State’, in which all four characteristics are weak, is found to be Greece and Ireland.
Limitations of this paper does not reveal (further) implications of the result cases (of OECD countries) including the best fit countries of the arrangement of causal set, the ‘strong green state’ of Norway, the ‘weak green state’ of Greece and Ireland, and the like. In addition, it did not address how each country of the twelve ideal types (except the ‘strong green state’ of Norway) is able to improve such weak elements among four criteria and seven elements of green state (ecological authoritarianism (environmental tax), ecological modernization (environmental innovation (patent), GDP per capita), ecological democracy (democracy index, environmental governance), and environmental welfare (social expenditure, environmental health) through policy alternatives. Therefore, subsequent studies would support more concrete implications.
Author Contributions
T.H., the first author designed the very structure of the article and completed the writing-up under the cooperation with co-authors. Y.K., as the corresponding author contributed in completing the writing-up and revising the article as a whole. Last but not least, the other co-author, J.H.K. has also aided in completing the writing-up as well as the proofreading.
Funding
This research received no external funding.
Conflicts of Interest
The authors declare no conflict of interest.
References
- Meadowcroft, J. Comparative Environmental Politics: Theory, Practice, and Prospects; MIT Press: Cambridge, MA, USA, 2012; pp. 63–87. [Google Scholar]
- Peters, M.A. Education for ecological democracy. Educ. Philos. Theory 2017, 46, 941–945. [Google Scholar] [CrossRef]
- Gough, I.; James, M.; John, D.; Jürgen, G.; Holger, L.; Anil, M.; Ramon, O. JESP symposium: Climate change and social policy. J. Eur. Soc. Policy 2008, 18, 325–344. [Google Scholar] [CrossRef][Green Version]
- Eckersly, R. Green Justice, the State and Democracy. In Proceedings of the Environmental Justice: Global Ethics for the 21st Century Conference, hosted Melbourne University, Melbourne, Australia, 1–3 October 1997; pp. 169–199. [Google Scholar]
- Eckersley, R. The Green State: Rethinking Democracy and Sovereignty; The MIT Press: Cambridge, MA, USA, 2004. [Google Scholar]
- Lafferty, W.M. Democracy and Regional Sustainable Development: Probing the Need for a New Demos with a New Rationality; The Nation-State and the Ecological Crisis and the Nation State: Sovereignty, Economy and Ecology: Grenoble, France, 2001. [Google Scholar]
- Bookchin, M. Thingking ecologically: a dialectical approach. Our Gener. 1987, 18, 3–40. [Google Scholar]
- Dobson, A. Green Political Theory; Unwin Hyman: London, UK, 1990. [Google Scholar]
- Eckersly, R. The Global Ecological Crisis and the Nation-State: Sovereinty, Economy and Ecology. Available online: https://ecpr.eu/Events/PanelDetails.aspx?PanelID=1427&EventID=45 (accessed on 28 August 2018).
- Cho, M.R. Greening State Theories. Korean Political Sci. Rev. 2002, 36, 47–68. [Google Scholar]
- Eckersly, R. Greening the Nation-State: From Exclusive to Inclusive Sovereignty, Economy and Ecology; European Consortium for Political Research Annual Joint Sessions: Grenoble, France, 2001. [Google Scholar]
- Eckersley, R. National identities, international roles, and the legitimation of climate leadership: Germany and Norway compared. Environ. Politics 2016, 25, 180–201. [Google Scholar] [CrossRef]
- Goodin, R. The Politics of the Environment; Edward Elgar Pub: Cheltenham, UK, 1994. [Google Scholar]
- Torgerson, D. The Promise of Green Politics; Duke University Press: Durham, NC, USA, 1999. [Google Scholar]
- Dryzek, J.S. The Politics of the Earth: Environmental Discourses; Oxford University Press: New York, NY, USA, 2005. [Google Scholar]
- Lundqvist, L.J. A green fist in a velvet glove: the ecological state and sustainable development. Environ. Values 2001, 10, 455–472. [Google Scholar] [CrossRef]
- Meadowcroft, J. From welfare state to ecostate. State Glob. Ecol. Crisis 2005, 26, 3–23. [Google Scholar]
- Duit, A. State and Environment the Comparative Study of Environmental Governance; The MIT Press: Cambridge, MA, USA, 2014. [Google Scholar]
- Christoff, P. Out of chaos a shining styar? Towards a typology of green states. State Glob. Ecol. Crisis 2005, 26, 25–52. [Google Scholar]
- Dryzek, J.S.; Downes, D.; Hunold, C.; Schlosberg, D.; Hernes, H.K. Green States and Social Movements: Environmentalism in the United States, United Kingdom, Germany and Norway; Oxford University Press: Oxford, UK, 2003. [Google Scholar]
- Connelly, S. Mapping sustainable development as a contested concept. Local Environ. 2007, 12, 259–278. [Google Scholar] [CrossRef]
- Lafferty, W.M. Democracy and Ecological Rationality: New Trials for an Old Ceremony. Available online: https://research.utwente.nl/en/publications/democracy-and-ecological-rationality-new-trials-for-an-old-ceremo (accessed on 28 August 2018).
- Duit, A. The four faces of the environmental state: Environmental governance regimes in 28 countries. Environ. Politics 2016, 25, 69–91. [Google Scholar] [CrossRef]
- Meier, G.M.; Stiglitz, J.E. Frontiers of Development Economics: the Future in Perspective; The World Bank: Washington, DC, USA, 2001. [Google Scholar]
- Duit, A.; Feindt, P.H.; Meadowcroft, J. Greening L.: The rise of the environmental state. Environ. Politics 2016, 25, 1–23. [Google Scholar] [CrossRef]
- Nelson, B. The Making of the Modern State: A Theoretical Evolution; Palgrave Macmillan: New York, NY, USA, 2006. [Google Scholar]
- Jordan, A.; Lenschow, A. Environmental policy integration: A state of the art review. Environ. Policy Gov. 2010, 20, 147–158. [Google Scholar] [CrossRef]
- Jung, G.H. Theoretical Implications for the Green State. In Exploring the Green State; Arche: Seoul, Korea, 2006; pp. 17–44. [Google Scholar]
- De Geus, M. The Ecological Restructuring of the State. In Democracy and Green Political Thought: Sustainability, Rights and Citizenship; 1996; pp. 188–211. Available online: https://www.taylorfrancis.com/books/e/9781134762064/chapters/10.4324%2F9780203449554-21 (accessed on 28 August 2018).
- Beeson, M. The coming of environmental authoritarianism. Environ. Politics 2010, 19, 276–294. [Google Scholar] [CrossRef]
- McAllister, L. Making Law Matter: Environmental Protection and Legal Institutions in Brazil; Stanford Law Books: Stanford, CA, USA, 2008. [Google Scholar]
- Moore, S.M. Modernisation, authoritarianism, and the environment: the politics of China’s South–North Water Transfer Project. Environ. Politics 2014, 23, 947–964. [Google Scholar] [CrossRef]
- Hochstetler, K.; Keck, M. Greening Brazil: Environmental Activism in State and Society; Duke University Press: Durham, NC, USA, 2007. [Google Scholar]
- Jung, G.H. Greening of the Administrative System. Exploring the Green State; Arche: Seoul, Korea, 2006; pp. 157–200. [Google Scholar]
- World Commission on Environment and Development (WCED). Our Common Future; Oxford University Press: London, UK, 1987. [Google Scholar]
- Zeijl-Rozema, A.; Cörvers, R.; Kemp, R.; Martens, P. Governance for sustainable development: A framework. Sustain. Dev. 2008, 16, 410–421. [Google Scholar] [CrossRef]
- Mullenite, J.M. The Political Ecology of the State: The Basis and the Evolution of Environmental Statehood. J. Ecol. Anthropol. 2014, 17, 54–56. [Google Scholar] [CrossRef]
- Armeanu, D.; Vintilă, G.; Vasile, J.; Ştefan, A.; Gherghina, C.; Drăgoi, M.C.; Teodor, C. Exploring the Link between Environmental Pollution and Economic Growth in EU-28 Countries: Is There an Environmental Kuznets Curve? PLoS ONE 2018, 13, e0195708. Available online: https://journals.plos.org/plosone/article?id=10.1371/journal.pone.0195708 (accessed on 28 August 2018). [CrossRef] [PubMed]
- Mol, A. Ecological modernization and the environmental transition of Europe. J. Environ. Policy Plan. 1999, 1, 167–181. [Google Scholar] [CrossRef]
- Mol, A.; Sonnenfeld, D. Ecological Modernization Around the World: An Introduction. Environ. Politics 2000, 9, 3–16. [Google Scholar] [CrossRef]
- Moon, S.H. The Structure and Process of the Discussion of The Green State: the Typology of the Green State; Green Politics and Green State: Seoul, Korea, 2002. [Google Scholar]
- Armeanu, D.; Vintilă, G.; Gherghina, C. Empirical Study towards the Drivers of Sustainable Economic Growth in EU-28 Countries. Sustainability 2018, 10, 4. [Google Scholar]
- Schlosberg, D. Ecological Justice and Ecological Democracy; Ecological Democracy Workshop in University of Sydney: Sydney, Australia, 2017. [Google Scholar]
- Dryzek, J.S. Ecology and Discursive Democracy: Beyond Liberal Capitalism and the Administrative State. Capital. Nat. Soc. 1992, 3, 18–42. [Google Scholar] [CrossRef]
- Dryzek, J.S. Deliberative Democracy and Beyond: Liberals, Critics, Contestations; Oxford University Press: Oxford, UK, 2002. [Google Scholar]
- Bailey, D. The Environmental Paradox of the Welfare State: The Dynamics of Sustainability. New Political Econ. 2015, 20, 793–811. [Google Scholar] [CrossRef]
- Meadowcroft, J. From Welfare State to Environmental State. J. Eur. Soc. Policy 2008, 18, 325–344. [Google Scholar]
- Gough, I. Welfare states and environmental states: A comparative analysis. Environ. Politics 2016, 25, 24–47. [Google Scholar] [CrossRef][Green Version]
- Gough, I.; Meadowcroft, J. Decarbonizing the Welfare State. Decarbonizing the Welfare State; Oxford University Press: Oxford, UK, 2011. [Google Scholar]
- Gough, I. Carbon Mitigation Policies, Distributional Dilemmas and Social Policies. J. Soc. Policy 2013, 42, 191–213. [Google Scholar] [CrossRef][Green Version]
- Choi, Y.J. Social science method: fuzzy ideal center of analysis and factor analysis. J. Gov. Stud. 2009, 15, 307–337. [Google Scholar]
- Schneider, C.Q.; Rohlfing, I. Case studies nested in fuzzy-set QCA on sufficiency: formalizing case selection and causal inference. Sociol. Methods Res. 2016, 45, 526–568. [Google Scholar] [CrossRef]
- Ragin, C.C. Fuzzy-Set Social Science; University of Chicago Press: Chicago, IL, USA, 2000. [Google Scholar]
- Ragin, C.C. Redesigning Social Inquiry Fuzzy Sets and Beyond; University of Chicago Press: Chicago, IL, USA, 2008. [Google Scholar]
- Blossfeld, H.P.; Prein, G. Rational Choice Theory and Large Scale Data Analysis; Westview Press: Boulder, CO, USA, 1998. [Google Scholar]
- Gough, I. Globalizatoin and regional welfare regimes: The east asian case. Glob. Soc. Policy 2001, 1, 163–189. [Google Scholar] [CrossRef][Green Version]
- Bambra, C. The Worlds of Welfare: Illusory and Gender Blind? Soc. Policy Soc. 2004, 3, 201–211. [Google Scholar] [CrossRef]
- Katz, H.; Helmut, K.A.; Marcus, M.L. Fuzzy set approaches to the study of global civil society. Glob. Civ. Soc. 2006, 7, 186–196. [Google Scholar]
- Seok, J.E. Towards a Sustainable Welfare State: An Evaluation and Typology of OECD Countries Through the Fuzzy-set Ideal Types Analysis. Health Soc. Welf. Rev. 2014, 34, 5–35. [Google Scholar] [CrossRef]
- Yang, J.J.; Jung, Y.R. An Empirical Research of the Underdevelopment of the Welfare State. Korean Polit. Sci. Rev. 2012, 46, 79–97. [Google Scholar] [CrossRef]
- Rihoux, B. Qualitative Comparative Analysis (QCA) and Related Systematic Comparative Methods: Recent Advance and Remaining Challenges for Social Science Research. Int. Sociol. 2006, 21, 679–706. [Google Scholar] [CrossRef]
- Kvist, J. Welfare reform in the Nordic countries in the 1990s: using fuzzy-set theory to assess conformity to ideal types. J. Eur. Soc. Policy 1999, 9, 231–252. [Google Scholar] [CrossRef]
- Kvist, J. Fuzzy set ideal type analysis. J. Bus. Res. 2007, 60, 474–481. [Google Scholar] [CrossRef]
- Li, G.; Kou, G.; Lin, C.; Xu, L.; Liao, Y. Multi-attribute decision making with generalized fuzzy numbers. J. Oper. Res. Soc. 2015, 66, 1793–1803. [Google Scholar] [CrossRef]
- Sustainable Development Solutions Network (SDSN); The Bertelsmann Stiftung. The Sustainable Development Goal (SDG) Index; UN: New York, NY, USA, 2017. [Google Scholar]
- OECD Statistics in 2011. Available online: http://stats.oecd.org/index.aspx?r=264226# (accessed on 9 April 2018).
- OECD Statistics in 2014. Available online: http://stats.oecd.org/index.aspx?queryid=22009# (accessed on 9 April 2018).
- The Economist. Democracy Index 2017: Free Speech Under Attack; The Economist: London, UK, 2017. [Google Scholar]
- Environmental Sustainability Index. 2005 Environmental Sustainability Index; Yale University and Columbia University: New Haven, CT, USA; New York, NY, USA, 2005; Available online: http://sedac.ciesin.columbia.edu/data/collection/esi/sets/browse (accessed on 30 August 2018).
- Environmental Performance Index. 2018 Environmental Performance Index; Yale University and Columbia University: New Haven, CT, USA; New York, NY, USA, 2018; Available online: https://epi.envirocenter.yale.edu/2018/report/category/hlt (accessed on 30 August 2018).